Workforce Development Matters
Why Workforce Development Matters
The natural ebb and flow of labor force trends were disrupted by the COVID- 19 pandemic and have yet to return back to normalcy. Workforce and economic development data deliver insight on trends and shifts in the workforce, on a national, state, county, and city level. OWINN is dedicated to making data-driven decisions. The following section highlights recent workforce and economic data that frame the reason why workforce development and OWINN’s continued work in the State truly impacts the Nevada workforce.

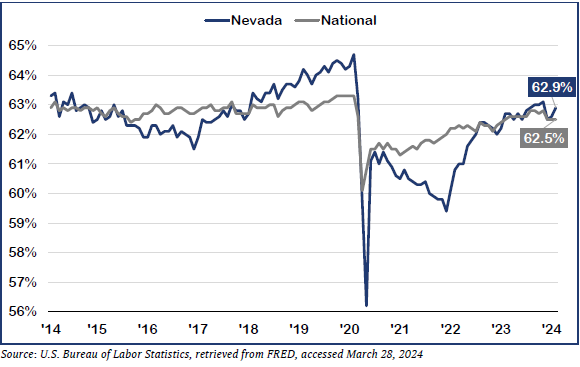
Labor Force Participation Rate
The labor force participation rate is calculated by adding the total number of people who are employed (actively working) and unemployed (not working, but able to work and are actively seeking work) divided by the total population. This data demonstrates that Nevada’s workforce is below the national average for labor force engagement.
Download
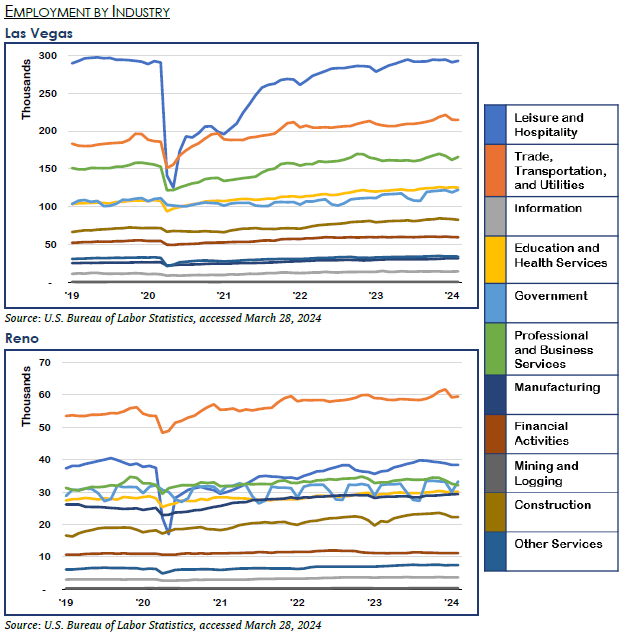
Employment By Industry
Industry employment vastly ranges between Nevada’s two metropolitan areas. Leisure and hospitality is the main industry in Las Vegas, comprising 26 percent of total employment in January 2023. Trade, transportation, and utilities is the main industry in Reno-Sparks, accounting for 22 percent of total employment in January 2023. Government employment in both regions has fluctuated in both regions, especially in Reno over the past five years. Construction, mining, and financial activities fared well in Las Vegas and Reno both pre and post pandemic. The industries that experienced the most growth from January 2018 to January 2023 were construction in Las Vegas (grew 32 percent) and manufacturing in Reno (grew 45 percent).
Link
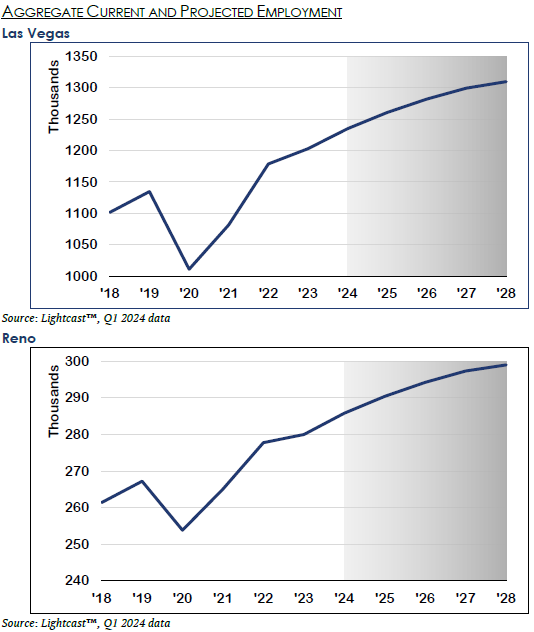
Current & Projected Employment
Short Description: The charts illustrate how COVID-19 impacted employment in Nevada’s largest cities and the projected employment growth over the next five years. Employment had significantly grown from 2017 to early 2020 before the pandemic wiped out hundreds of thousands of jobs for Nevadans.
Download
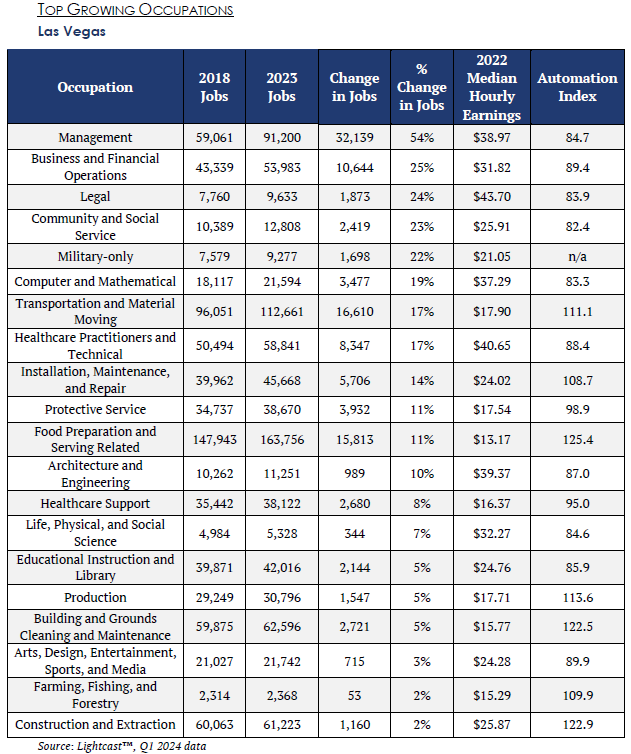
Top Growing Occupations
The Las Vegas workforce supply is constantly evolving. Occupations in management; legal; and life, physical and social sciences have all grown by 25 percent or more in the past five years. Office and administrative support occupations employ a majority of Southern Nevadans.
Download
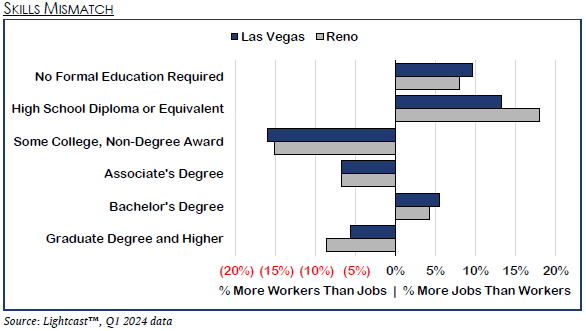
Skills Mismatch
Skills mismatch refers to the difference level of education that a person has versus the level of education required for a particular job. In the chart, bars on the right of the axis indicate that there are more jobs that require either no formal education, a high school diploma or equivalent, or bachelor’s degree than the number of workers who have those credentials.
Download
Nevada Industry Recognized Credentials
Learn More